Our Platform


Our Products
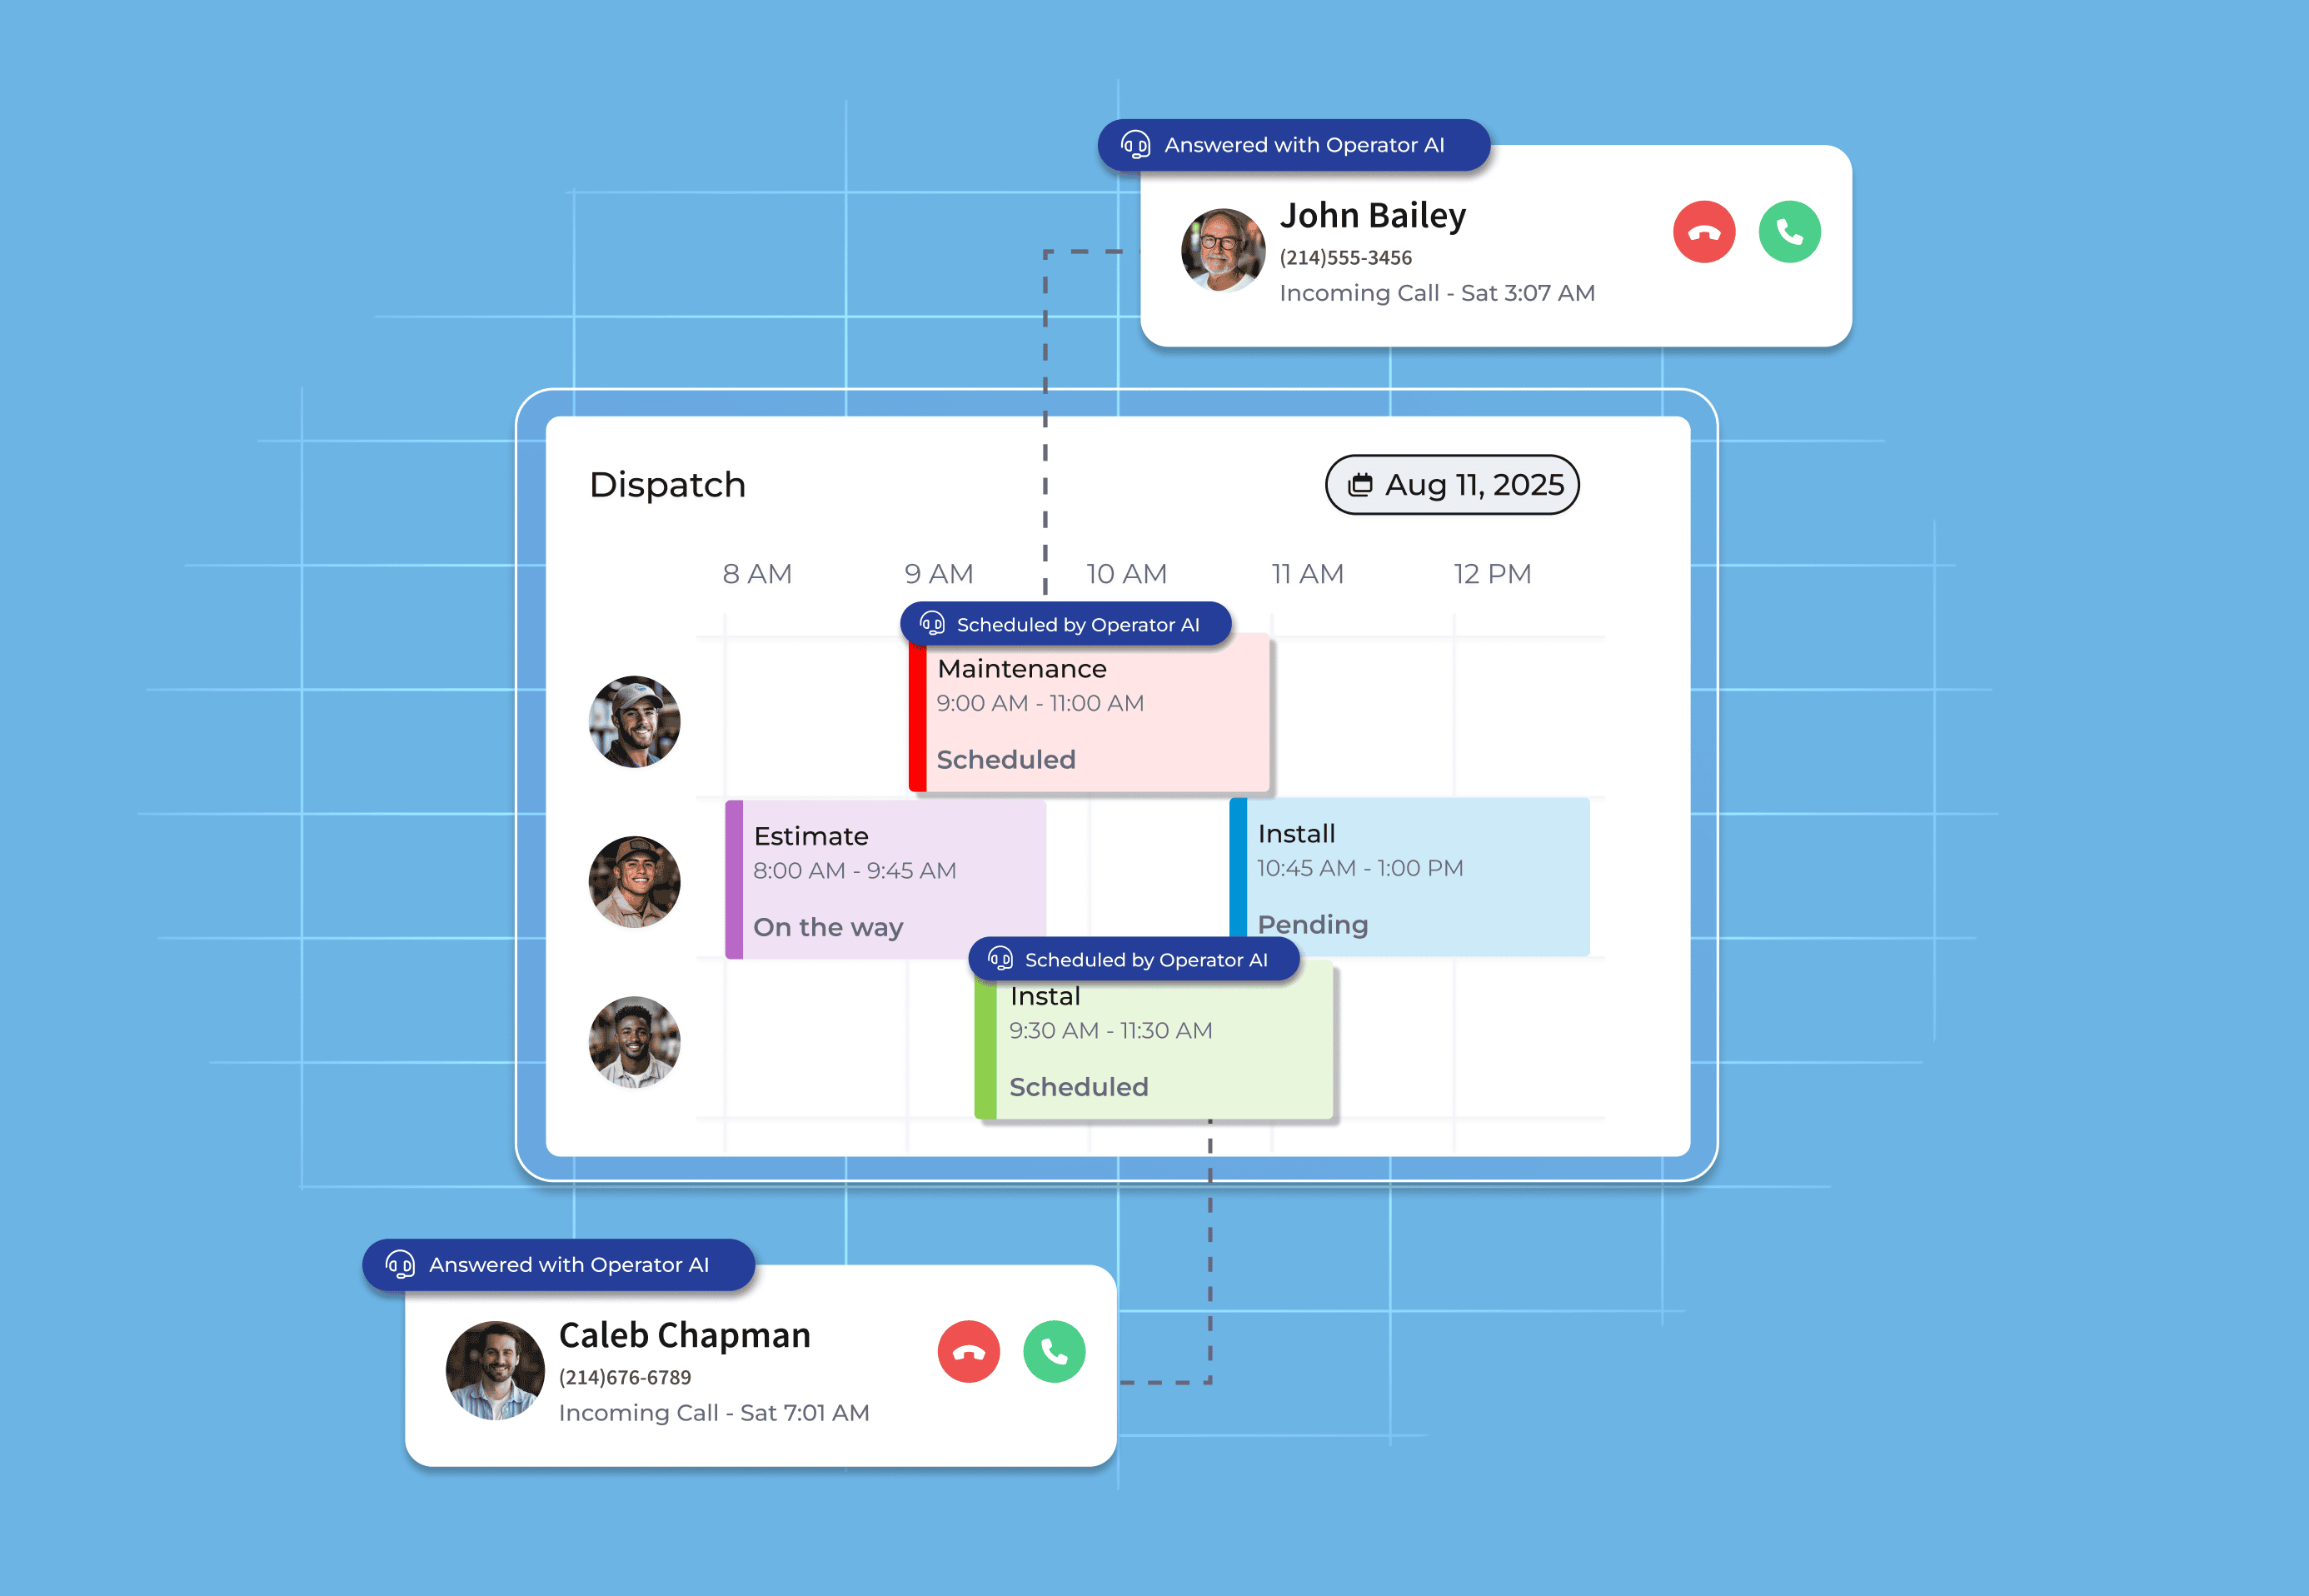
Operator AI
Capture leads and book jobs with AI.
NewClearpath
Design every workflow and ensure your team sticks to it.
Custom Forms
Stop hunting for paperwork with digital forms.
Pricebook
Build custom Pricebooks to boost your sales.
Engage
All your communication in one place.
Fleet Tracking
Monitor your fleet from one dashboard.
By Industry
By Segments
Learn
Connect
Discover

About Us
Sales +1 (817) 635-2218 Customer Support (469) 382-5668


How to Calculate Your HVAC Business Profit Margin (Free Calculator Included)
Learn everything you need to know about HVAC business profit margin. See what KPIs to track, tools you can use, and use our free calculator to measure them.
May 27, 2026

Share


Your schedule is booked three weeks out. Revenue looks strong. But at the end of the month, there’s almost nothing left.
Most HVAC owners track their revenue, but don’t know what each job actually costs to deliver.
Profit margin is the difference between what you charge and what it costs to deliver the work. It’s the gap between running a busy business and running a profitable one.
In this article, you’ll learn what a good HVAC business profit margin is, factors that affect it, and the industry benchmarks you can use to compare.
Key Insights
- Most HVAC companies run a net profit margin between 5% and 12%. A few well-run operations push past 15%.
- Gross margin and net profit margin measure different things. Confusing them is one of the most common reasons owners overestimate their profitability.
- Labor costs, pricing model, service mix, and callbacks are the biggest factors that affect your margin.
- Revenue alone doesn’t tell you if your business is healthy. A fully booked schedule can still lose money if job costs aren’t tracked.
What is a Good HVAC Business Profit Margin?
A good profit margin depends on your business size, service type, and overhead costs.
But the industry does have benchmarks worth knowing.
Most HVAC companies run a net profit margin between 5% and 12%, but a few well-run operations may also push past 15%.
Where you land within that range depends on what kind of work makes up most of your revenue and how tightly you manage what you spend to deliver it.
Gross Margin vs. Net Profit Margin
Most HVAC owners use gross margin and net profit margin interchangeably. They measure different metrics, and confusing them is one of the most common reasons owners think they are profitable when the business is struggling.
Gross profit margin measures how much revenue remains after paying the direct costs of completing a job. Direct costs include labor, parts, equipment, and materials.
Net profit margin measures what is left after every single cost is paid, including direct job costs, overhead, insurance, fuel, admin salaries, taxes, and owner compensation.
A good average HVAC gross profit margin is around 40–60%, while a good average net profit margin can be between 10 and 20%.
What Factors Affect Your HVAC Business Profit Margin?
Here are some factors that affect profit margin in the HVAC business:
Labor Costs
Labor is the largest expense in most HVAC businesses, often accounting for a third of total costs. When technicians are underutilized, stuck in traffic, or spending time on callbacks, you are paying for hours that generate no revenue.
Pricing Model
How you price jobs determines how much margin each job produces before a single cost is paid. HVAC businesses that price based on what competitors charge or what feels right to win the job consistently underprice their work.
Profitable businesses price based on actual job costs plus a target margin, working backward from what the business needs to stay healthy.
Service Type
Not all HVAC work produces the same margin. Service calls and maintenance agreements carry lower material costs, which means more revenue stays after the job closes. Installation jobs involve higher equipment and material costs, which compress margins.
If your HVAC business provides more installations, you may see lower margins than one with a strong base of recurring service work.
Overhead
Overhead costs like rent, insurance, vehicle expenses, and admin salaries don’t change based on how many jobs you complete. When revenue dips, overhead stays the same and eats a larger share of what comes in.
Businesses that grow their overhead faster than their revenue will see their margin shrink, even during busy periods.
Seasonality
HVAC demand peaks in summer and winter and drops in between. During slow periods, overhead keeps running while revenue slows down.
Businesses without a plan for the off-season, such as maintenance agreements, service contracts, or cash reserves, often end up spending the margin they built during peak months just to keep the lights on.
Callbacks and Rework
Every callback sends a technician back to a job that was already invoiced. The labor cost of that return visit comes directly out of the margin the original job produced.
One callback per week across a full year affects your margin, yet most owners never calculate how much it costs.
How to Calculate HVAC Business Profit Margin
Here’s how you can calculate your profit margin manually.
Formula:
Profit Margin (%) = (Revenue − Total Costs) ÷ Revenue × 100
Where:
- Revenue is the amount of money you collected over the period you want to measure (a month, a quarter, or a full year).
- Total costs are direct job costs and overhead costs.
The higher the percentage, the more money your business retains after paying all costs. For example, a 15% margin means the business keeps 15 cents from every dollar it earns. A 5% margin means it only keeps 5 cents from every dollar it earns.
KPIs You Should Track for Your HVAC Business
Here are some KPIs you should track for your HVAC business:
- Revenue Per Job: This metric measures the average amount your business collects across all completed jobs. A low average often signals underpricing, a heavy mix of small repair calls, or both.
- Gross Profit Per Job: This metric calculates what remains from each job after paying direct costs. Two jobs with the same revenue can produce different gross profits depending on labor hours, material costs, and how accurately the job was priced.
- Labor Cost Percentage: This metric measures what your business spends on technician labor as a share of total revenue. When labor costs grow faster than revenue, margin shrinks.
- Revenue Per Technician: This metric shows how much revenue each technician generates over a given period.
- Overhead Rate: This shows what percentage of revenue goes toward running the business rather than delivering work. Rent, insurance, vehicles, and admin salaries all factor in.
- First-Time Fix Rate: This metric shows how often your technicians resolve a job completely on the first visit. A low first-time fix rate increases repeat visits, which add labor costs to jobs already invoiced and closed.
- Callback Rate: This metric measures how often customers call back after a completed job because the work was not finished correctly. Callbacks are costly in two ways: the labor cost of the return visit and the risk of losing a customer.
Download the HVAC Business Profit Margin Calculator
To make it easy for you to calculate your business’s profit margin, we have created a Google Sheet template that does the math for you quickly.
This template is useful for small to mid-sized HVAC business owners. Simply enter your revenue and costs once, and the calculator outputs your net profit and profit margin percentage instantly.
The calculator covers every cost category that affects your margin:
- Technician labor
- Parts and materials
- Equipment
- Subcontractor fees
- Rent and utilities
- Vehicle expenses and fuel
- Insurance
- Admin and office salaries
- Owner compensation
- Taxes
Make a copy of the free HVAC Profit Margin Calculator here.
Best Practices for Using the HVAC Business Profit Margin Calculator
Here are some best practices to calculate your HVAC business profit margin using our calculator:
- Include owner compensation as a cost: Many HVAC owners leave this out because it blurs into personal finances. If you are not counting what you pay yourself as a cost, your margin is overstated.
- Enter billable revenue only: Don’t include deposits, loans, or non-service income. The calculator measures what your HVAC work actually earns, not total cash inflow.
- Compare your result against the benchmark: Set your own benchmarks or use the ones included in the calculator sheet to assess your margin.
How FieldPulse Helps You Calculate and Improve Your HVAC Business Profit Margin
FieldPulse is a field service management software built for small to mid-sized field service businesses, including HVAC teams in commercial, residential, and franchise businesses. Our platform brings job management, estimating, invoicing, and reporting into one place. No more tracking costs across spreadsheets and disconnected tools.
Here’s how FieldPulse helps you track and protect your profit margin:
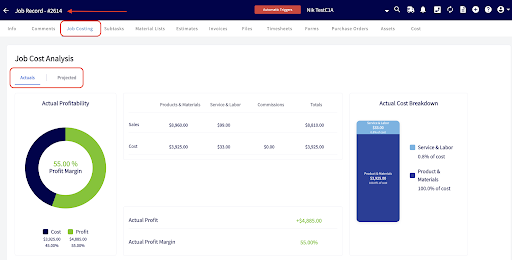
Job Profit Margin Reporting
Most HVAC businesses run a mix of service calls, maintenance agreements, and installation jobs. Each service type carries a different cost structure, which means each produces a different margin.
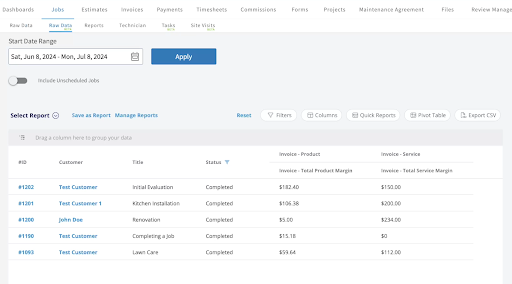
FieldPulse helps you track how much you earn from each job. You can customize your reporting dashboard to filter by service type, team member, and location.
Our software also allows you to generate profit margin reports on every completed job based on line-item costs by service or product. This helps you see where your business makes money and where jobs close at a margin too thin to sustain.
Cost Basis Tracking
Pricing jobs based on what you charged last time or what competitors charge in the area may hurt your profit.
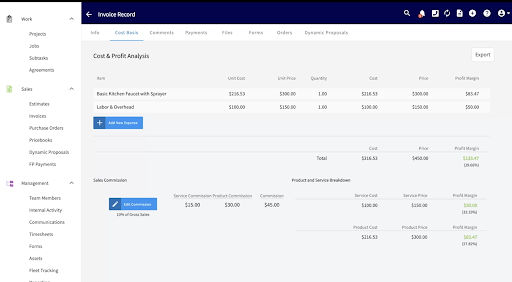
FieldPulse offers cost basis tracking. It carries an internal unit cost for every line item on your estimates and invoices. Our platform uses these costs to calculate profit margin per line item and per job. For example, if a technician adds parts on-site, those costs get logged against the job record in real-time.
You can also add additional expenses manually, and FieldPulse automatically applies the profit margin percentage accurately.
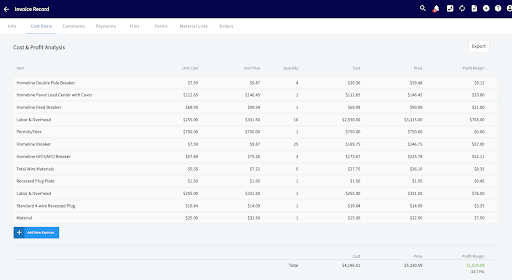
This gives you an accurate picture of what each job costs to deliver across labor, materials, and equipment. It also helps you improve your pricing strategy as you move forward.
You can also assign commission rates by team member on FieldPulse. Every time an invoice is generated, the platform automatically calculates commission by service and product and deducts it from the profit margin calculation. This helps you see what your technicians earn on the job, so you don’t overstate a number or make wrong pricing decisions.
Estimated vs. Actual Cost Comparison
Every HVAC job starts with an estimate. But what you quote and what the job actually costs to deliver are rarely the same. For example, a technician may spend an extra hour on site, or a part is swapped for a more expensive one.
FieldPulse’s job costing software helps you compare your projected costs against what the job actually costs.
You can pull the projected figures from your estimates and material lists, while the actual figures are pulled from your final invoices, purchase orders, and logged labor hours.
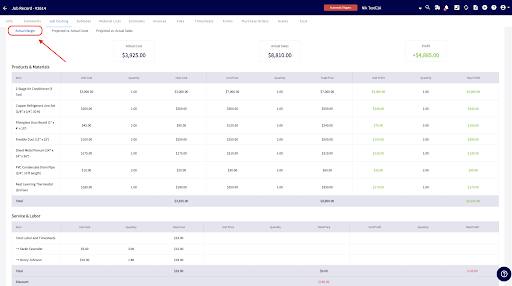
Our platform gives you a visual summary that shows your projected vs. actual profit and margin at a glance.
You can drill into three detailed views: actual margin per line item, projected vs. actual costs, and projected vs. actual sales.
This is useful for tracking jobs where upsells or change orders increased revenue beyond the original estimate.
Custom Reporting and KPI Tracking
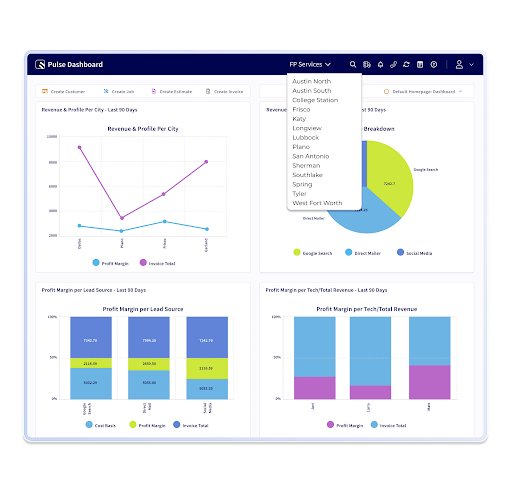
FieldPulse lets you build custom reports filtered by job type, technician, location, or date range. You can create widgets for important profit margin KPIs, including revenue per job, labor cost percentage, first-time fix rate, and callback rate.
Our software also lets you export findings for monthly reviews, so you can share them with your stakeholders.
Bottom Line: You Can’t Fix a Margin You Don’t Measure
Revenue tells you how much work your business does. Profit margin tells you how much of that work is actually worth doing.
The difference between a 5% margin and a 15% margin is knowing which jobs cost too much to deliver, which technicians produce the most profit, and where your overhead is eating into what you earn.
Start by calculating your current margin with the free calculator. Then track the KPIs covered in this article month over month. Small shifts in pricing, labor efficiency, and callback rates compound over time.
Ready to stop tracking this manually? Book a demo to see how FieldPulse puts your margin data on autopilot.