









Key Takeaways
-
Field operations KPIs should focus on four decisions: fixing jobs right the first time, using technician hours effectively, making money per job, and keeping customer commitments.
-
Most businesses track too many metrics. A short list of five to seven KPIs tied directly to weekly operational decisions works better. The seven listed below are a starting point, and you can trim to the five that match your biggest challenge.
-
First-time fix rate, callback rate, technician utilization, job-level profitability, and on-time arrival are the core KPIs that drive real behavior change.
-
Job-level profitability is the hardest KPI to calculate without integrated job costing, yet it reveals which work actually earns money versus which work is being carried.
-
FieldPulse provides the job costing, ClearPath workflow, and two-way QuickBooks sync needed to turn these KPIs into actionable weekly insights.
Top Field Operations KPIs for Residential Service Teams
The top field operations KPIs for a residential service business tie directly to decisions your team makes every week. For a 7-to-50-tech shop, that means a short list covering quality, capacity, profitability, and customer retention.
Here are the core KPIs at a glance:
-
First-time fix rate, the share of jobs resolved on the first visit without a return trip
-
Callback rate, the share of completed jobs that require an unplanned follow-up visit within 30 days
-
Technician utilization rate, the share of paid hours spent on billable work
-
Job-level profitability, revenue minus all actual costs (labor, parts, overhead) on a per-job basis
-
On-time arrival rate, the share of appointments where your tech arrives within the promised window
-
Time-to-invoice, the number of days between job completion and invoice delivery
-
SLA compliance rate, the share of jobs completed within the response or resolution time your business committed to
Metric Vs. KPI: Why 30 Numbers Slow You Down
A metric is any number you can measure. A KPI is a metric you choose on purpose because it connects to a decision your team actually makes.
Use this practical test. If the number moved in the wrong direction this week and your team would change their behavior, it is a KPI. If nothing would change, it is just a metric.
The goal is a dashboard your office administrator and dispatcher recognize as their own workload, not a spreadsheet that takes an afternoon to update.
Before you start tracking these KPIs, it helps to understand why so many teams end up with too many numbers.
The Four Decisions Your Field Service KPIs Should Answer
Organize KPIs by the decisions they drive instead of broad labels like efficiency or financial. For a residential service business running 7 to 50 techs, four decisions repeat every week.
Are We Fixing It Right the First Time?
First-time fix rate and callback rate work best together. Tracking one without the other hides the real problem.
A shop with a strong first-time fix rate but a rising callback rate may be closing jobs prematurely. A shop with a low first-time fix rate and a low callback rate may be doing thorough work but arriving unprepared.
Formula: First-time fix rate = jobs resolved on first visit ÷ total jobs × 100
Data source: Your job records and visit history inside your field service software.
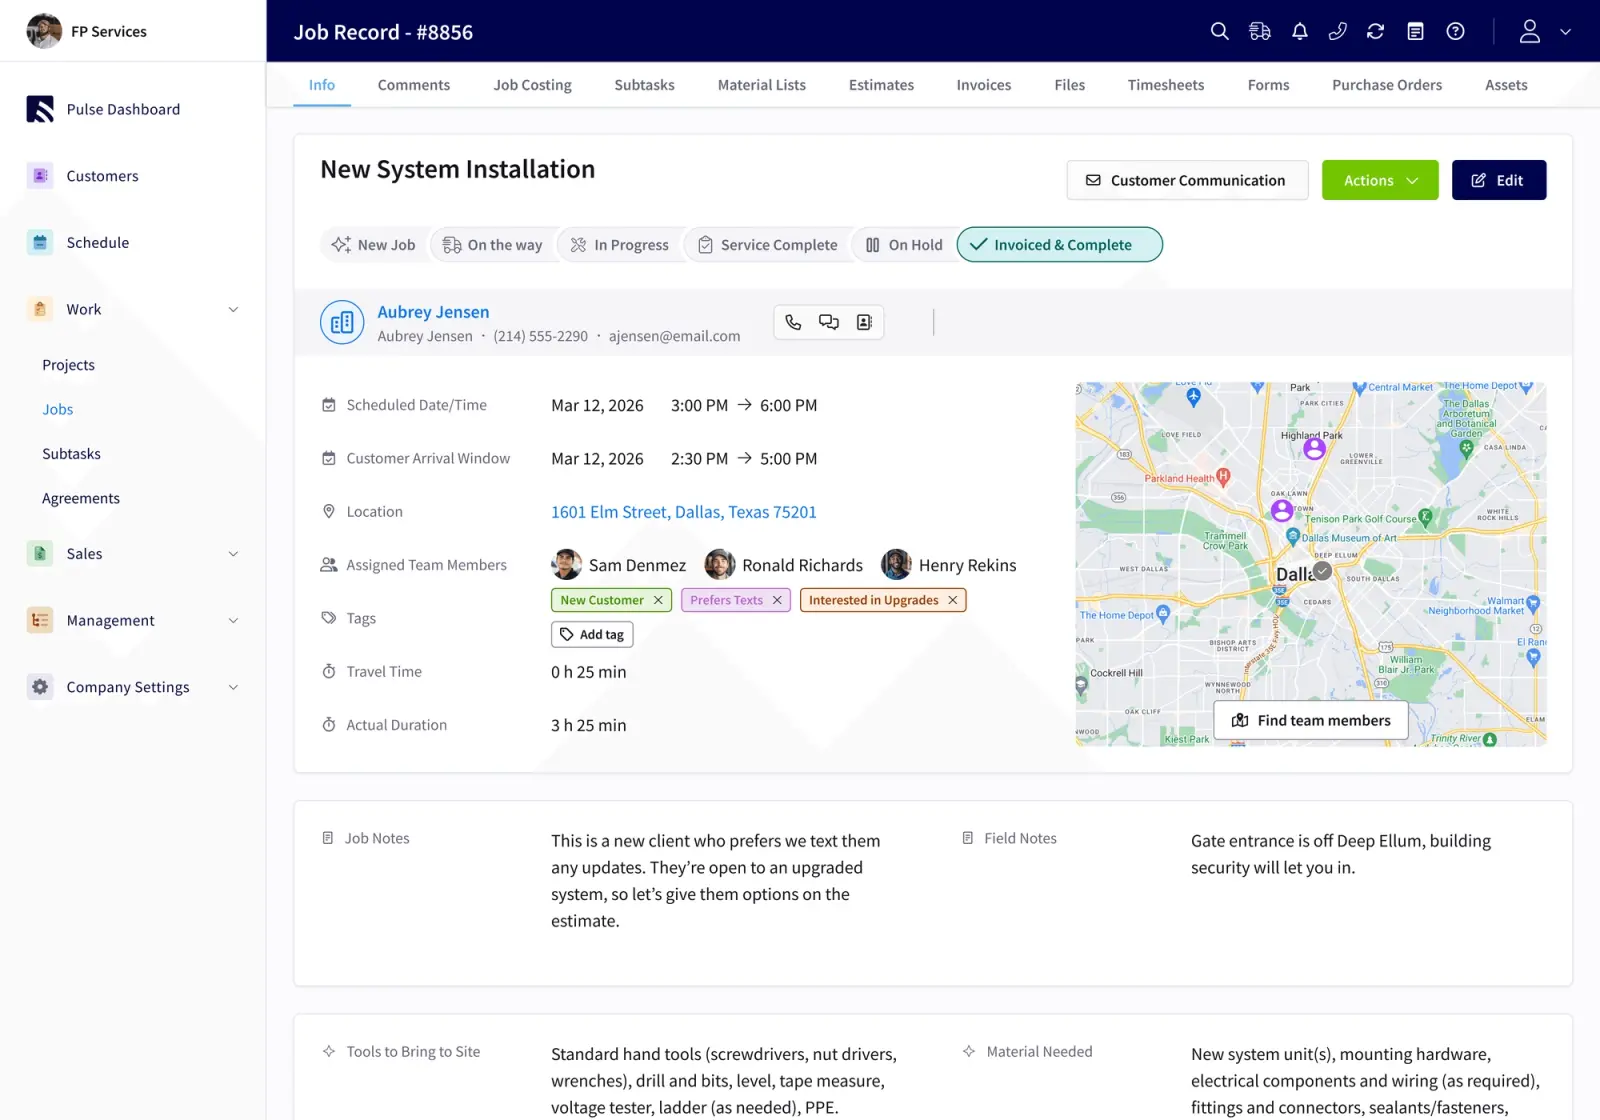
Trade-specific benchmarks for well-run shops put first-time fix rate at 75–85% for plumbing service, 70–82% for HVAC service, and 80–90% for garage door service. Aberdeen Group research on 156 field service organizations found an overall average of 75%, with best-in-class organizations reaching 89%.
When your first-time fix rate slips, the causes are almost always the same: parts not on the truck, the wrong tech assigned to the job, or an incomplete diagnosis before dispatch. Each of those causes leads to a return trip, and a single return trip typically costs a residential service shop between $85 and $180 in direct costs such as drive time, truck cost, parts re-pickup, scheduling friction, and dispatcher time, before counting the customer frustration or the lost slot for another job.
Are We Using Our Hours?
Formula: Technician utilization rate = productive field hours ÷ available technician hours × 100
Data source: Technician timesheets clocked against specific jobs.
One honest caveat: 100% utilization is a warning sign, not a goal. A tech running at full capacity has no time for travel between jobs, diagnostics, or training.
Are We Making Money?
Many owners recognize this pattern. You finish a strong month, the schedule was full, the trucks were busy, and you still cannot say which jobs made money.
The reason is that the inputs are scattered. Labor hours are not tied to specific jobs, parts costs live in one system, and revenue lives in another. By the time the invoice goes out a week after the job closes, the connection between cost and revenue is gone.
Job-level profitability is the KPI most owners cannot calculate at all. As of mid-2026, most small field service operations still measure profitability at the company level: revenue in, expenses out, one number at the end of the month. That tells you whether you are surviving, but nothing about which work is carrying you and which work is being carried.
This is where FieldPulse makes the clearest difference. Job costing in FieldPulse estimates your profit margin upfront and confirms actual profit after completion, with per-job profit and loss and line-item breakdowns of cost, price, and profit.
ClearPath, included in the core platform, turns your process into job stages with required actions at each step. Labor hours tie to specific jobs instead of disappearing into a weekly total. That connection is what makes job-level profitability visible at all.
RDI, a commercial interiors business in St. Louis, ran for fifty years without job-level profitability data. Once ClearPath tied labor hours to specific jobs, the owner could see which job categories carried the best profit margin and shift the business toward them: “I wasn’t really thinking about it until we went into the data. Wow, we have really great margins on these sorts of jobs. Let’s push it more into that.”
FieldPulse also includes 60+ prebuilt reports plus custom dashboards, and a two-way QuickBooks Online sync so the numbers your office reports and the numbers your books hold stay aligned. When your bookkeeper corrects something in QuickBooks Online, the fix carries back into FieldPulse.
Are We Keeping Customers?
On-time arrival and SLA compliance are your customer-facing commitments. Shifton’s 2026 field service KPI guide reports that customers who experience missed service windows rarely complain directly. They quietly switch providers, and the signal shows up in renewal rates rather than complaint logs.

CSAT and NPS are useful for residential service businesses once you have enough volume to make the scores statistically meaningful. Until then, a strong CSAT score based on very few surveys can mislead, so track sample size alongside the score.
For most 7-to-50-tech shops, on-time arrival rate and callback rate are more actionable week to week than NPS.
Which KPIs Matter At 7 Techs Vs. 25 Techs?
Those four decisions stay the same as you grow, but the KPIs that matter most shift with the size of your team. What breaks operationally at 7 techs is not what breaks at 25.
At 7 techs: The owner still covers gaps from memory. The priority numbers are first-time fix rate, callback rate, and on-time arrival. These tell you whether the work is being done right and whether customers are getting what they were promised. Job-level profitability matters too, but the owner can often reconstruct it manually for a small job volume.
At 25 techs: Memory stops covering the gaps. Every gap turns into a phone call, a lost hour, or an invoice that never went out. At this stage, job-level profitability, technician utilization, time-to-invoice, and SLA compliance become the numbers that matter, because without them, the owner has no way to know which parts of the business are carrying the rest. Hard Hat Helpers notes that a company 20% inefficient loses one technician’s worth of productivity at 5 technicians but loses five technicians’ worth at 25, which makes operational measurement increasingly critical at scale.
The Catalyst for the Trades segments KPI priorities by business stage: early-stage shops focus on stability, growth-stage shops focus on consistency, and scaling shops focus on efficiency and leverage. The KPI set that served you well at 7 techs will not serve you at 25, and the businesses that adjust early are the ones that scale without breaking operationally.
Drop These: Field Service Metrics That Look Like KPIs
Some commonly tracked numbers are activity reports, not KPIs. They are easy to grow and easy to report, but they do not answer the question your business is actually asking.
-
Total jobs completed, which shows volume without profit margin. A busy month with low-profit jobs is worse than a lighter month with high-profit ones. This number tells you how busy your team was, not whether the work was worth doing.
-
Raw revenue, which says nothing about which jobs made money. A $1.2M month with 28% actual profit margin after full cost assignment looks very different from the same revenue at 48% gross margin. Level’s analysis of contractor data found that dashboards commonly show an average gross margin of 48% when the real margin after full cost assignment is closer to 28%.
-
Average revenue per job without cost attached, which is a ticket size number with no profit margin context. A high average ticket on jobs that run over on labor and require callbacks does not help your business.
Field Operations KPIs Example: A 12-Truck Dashboard
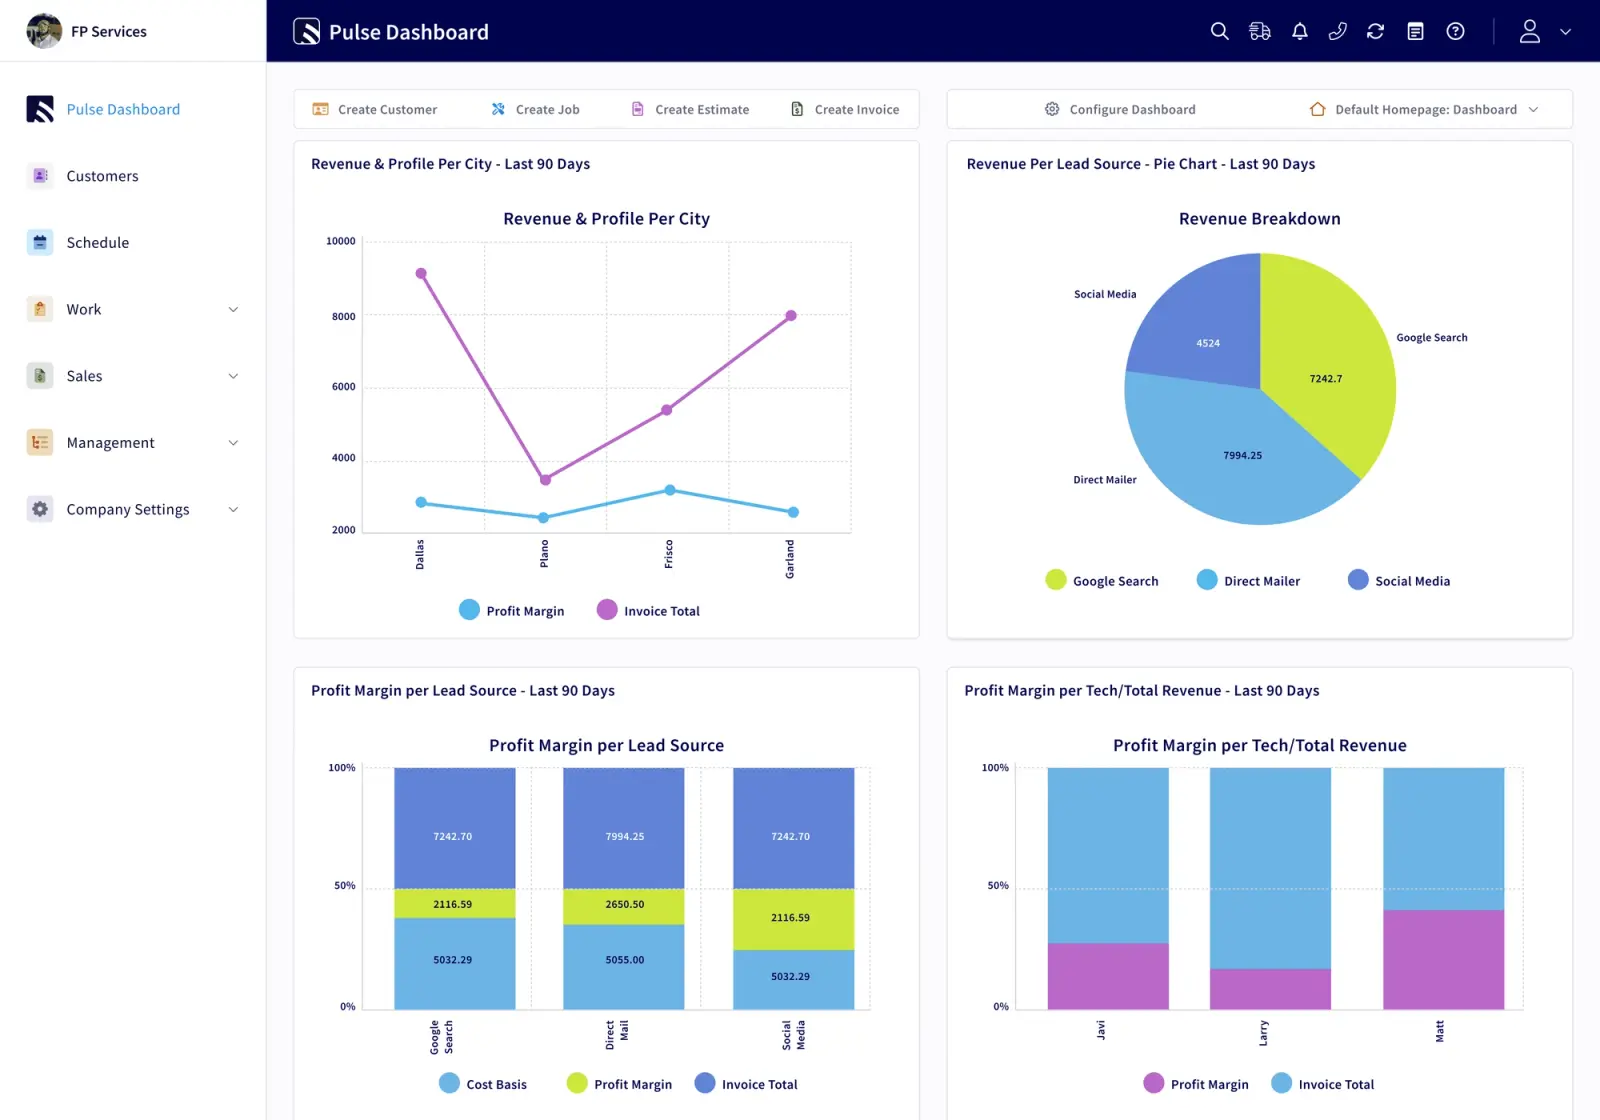
Here is what a practical field operations KPI dashboard looks like for a 12-truck HVAC, plumbing, or garage door business. Notice that each KPI has a clear formula, a data source you already have, and a healthy target range, so you can tell at a glance whether a number is on track or needs attention.
|
KPI |
Formula |
Data Source |
Healthy Target |
|---|---|---|---|
|
First-time fix rate |
Jobs resolved on first visit ÷ total jobs × 100 |
Job records and visit history |
75–85% |
|
Technician utilization rate |
Productive field hours ÷ available hours × 100 |
Technician timesheets clocked by job |
70–85% |
|
Job-level profitability |
Revenue − (labor + parts + overhead) per job |
Job costing records linked to timesheets and parts logs |
30–50% gross profit margin |
|
On-time arrival rate |
On-time arrivals ÷ completed appointments × 100 |
Scheduled vs. actual arrival times |
85%+ |
|
Time-to-invoice |
Days from job completion to invoice delivery |
Job close date vs. invoice send date |
Find out which jobs are carrying your business — book a demo
Frequently Asked Questions
What Are the Top 3 KPIs for Operations?
For a residential service business, the three that matter most are first-time fix rate, job-level profitability, and technician utilization rate.
First-time fix rate tells you whether your team is prepared and dispatched correctly. Job-level profitability tells you whether the work is worth doing. Technician utilization tells you whether your capacity is being used or wasted. If you can only watch three numbers, watch those.
What Are the Four Main KPIs?
Organized by the decision they drive, the four main KPIs are first-time fix rate (are we fixing it right the first time?), technician utilization rate (are we using our hours?), job-level profitability (are we making money?), and on-time arrival rate (are we keeping our commitments to customers?). These four cover quality, capacity, economics, and customer experience without overlap.
Why Can’t Most Owners Calculate Job-Level Profitability?
The inputs live in different places. Labor hours are tracked at the week level, not the job level. Parts costs sit in one system. Revenue sits in another. The invoice goes out days after the job closes.
Without a platform that ties technician clock-in and clock-out to a specific job record and links that to parts used and the final invoice, job-level profitability has to be reconstructed manually. Most owners do not have time to do that consistently.
How Often Should Field Service KPIs Be Reviewed?
Operational KPIs like first-time fix rate, on-time arrival, and callback rate should be reviewed weekly. Problems that only show up in monthly reporting have already cost you revenue.
Financial KPIs like job-level profitability and time-to-invoice support a monthly review cadence. The review should be short and tied to a specific action. For example, if first-time fix rate drops below your threshold, the next step is reviewing parts staging and dispatch skill-matching.
What Is the Difference Between a Callback Rate and a First-Time Fix Rate?
First-time fix rate measures the share of jobs resolved on the first visit. Callback rate measures the share of completed jobs that require an unplanned return visit within 30 days for the same issue.
They are related but not the same. A job can be marked complete on the first visit and still generate a callback three weeks later. Tracking both gives you a fuller picture of work quality than either number alone.
When Should a Growing Service Business Add More KPIs to Its Dashboard?
Add a KPI when a result moves outside its target and you need a diagnostic metric to understand why.
For example, if job-level profitability drops, you might add a labor variance metric, such as estimated hours versus actual hours per job, to find out whether the problem is in estimating or in field execution. Do not add metrics just because they are available. Add them because a specific question needs answering.
Conclusion: Build A Short List That Drives Action
Most residential service businesses track too many KPIs, track the wrong ones, and lack a reliable way to calculate the one that matters most.
The fix is a shorter list, organized by the decision each number drives. Each KPI should have a formula, a data source, and a clear action when the number moves the wrong way.
When you evaluate any measurement system for your business, three questions cut through the noise:
-
Does it tie labor hours to specific jobs, not to a weekly total?
-
Does it show per-job profit margin with line-item cost and revenue breakdowns?
-
Does it keep your office and your books working from the same numbers, so a correction in one place carries to the other?
If the answer to any of those is no, the dashboard is showing you activity instead of economics. FieldPulse is built to answer all three. The job costing, ClearPath workflow, and QuickBooks sync described earlier are designed to make these KPIs actionable.
On average, FieldPulse customers experience 25% gains in efficiency, with office teams saving 40+ hours per month.
See how your KPIs change with FieldPulse — schedule a demo
If you are an office administrator or dispatcher wondering where your administrative workload is heaviest across intake, field visibility, and invoicing, find out where to focus first. Take the three-minute Admin Workload Assessment.