







Key Takeaways
- Most field service dashboards report history instead of driving real-time decisions, so dispatchers and managers chase updates manually.
- The five core KPIs every dashboard should track are first-time fix rate, technician utilization, average response time, revenue per job, and customer satisfaction.
- Role-based views keep owners focused on financial metrics, dispatchers on operational status, and techs on their schedule and job details.
- Strong dashboards limit each view to 5–7 KPIs, automate data feeds, and include regular reviews so you turn numbers into action.
- FieldPulse automates KPI tracking from job data and lets you build role-based dashboards—see it in action for your team.
What Is a Field Service KPI Dashboard?
A field service KPI dashboard is a real-time view of your key numbers, like first-time fix rate, technician utilization, and revenue per job. It helps you monitor operational health and make decisions quickly.
The dashboard gives each role (owner, dispatcher, tech) the specific metrics they need to act fast. It goes beyond a historical report and highlights issues before they become expensive problems.
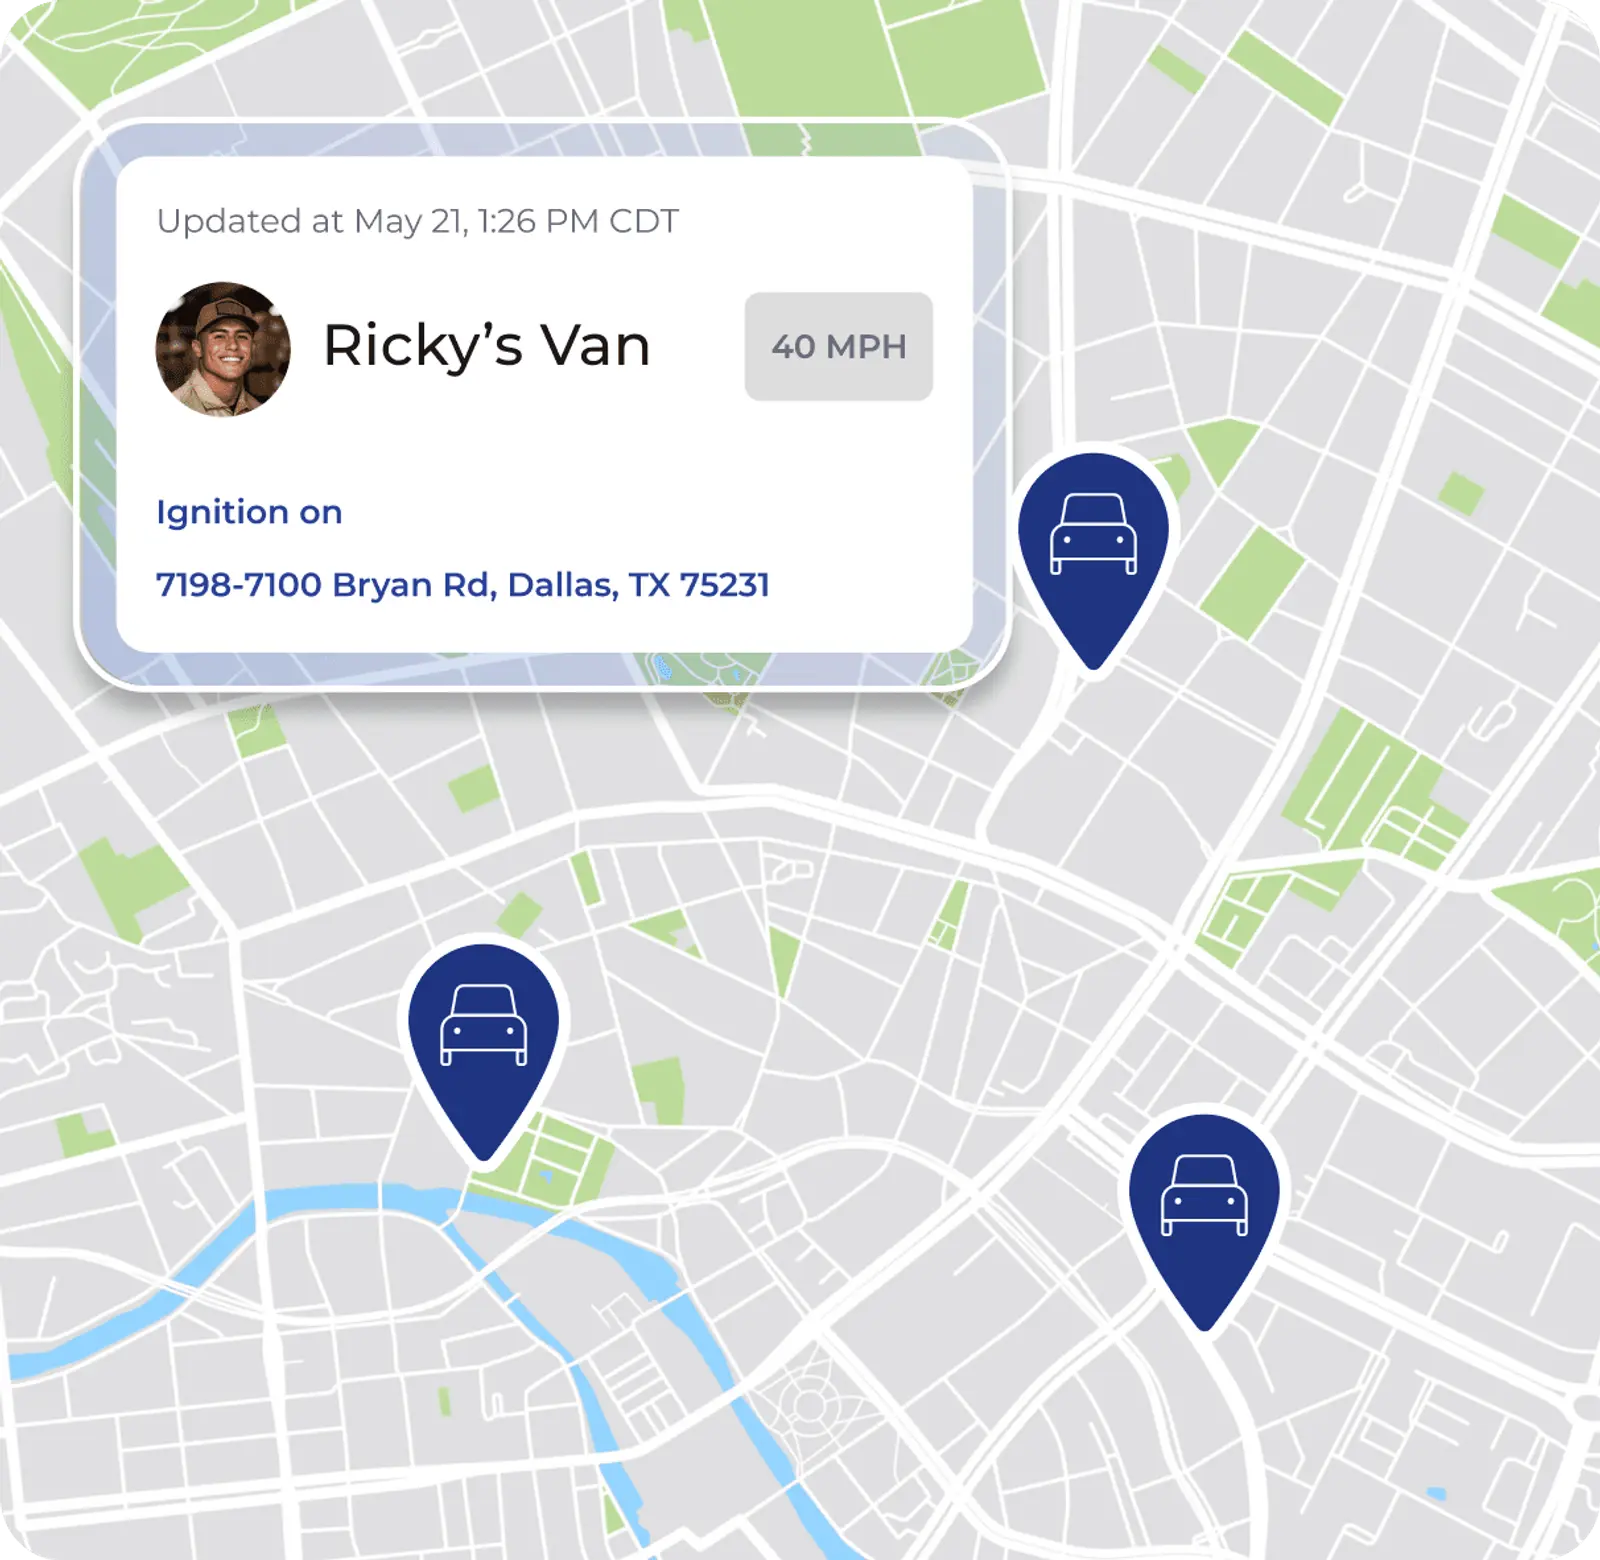
A report tells you what happened. A dashboard shows what is happening now and flags where you need to step in.
The 5 Core KPIs Every Field Service Dashboard Should Track
Most field service businesses track too many metrics or the wrong ones. Start with these five. Each one connects directly to a decision you make every day. The table below shows what each KPI measures, how to calculate it, and the benchmark that signals healthy performance.
| KPI | Definition | Formula | Benchmark |
|---|---|---|---|
| First-Time Fix Rate (FTFR) | Percentage of jobs resolved on the first visit | (Jobs completed on first visit ÷ Total eligible jobs) × 100 | 75–85% average; 90%+ excellent |
| Technician Utilization | Percentage of paid time spent on billable work | (Billable hours ÷ Available hours) × 100 | 65–80%; above 85% signals overload |
| Average Response Time | Time from customer request to technician arrival | Total response time ÷ Number of service requests | Under 4 hours for emergency; same/next day for routine |
| Revenue per Job / Job Profitability | Average revenue or profit per completed job | Total revenue ÷ Jobs completed (or revenue minus labor, materials, overhead per job) | Varies by trade; track trend over time and by job type |
| Customer Satisfaction (CSAT) | Post-job survey scores measuring customer experience | (Positive responses ÷ Total survey responses) × 100 | 4.2+/5.0 or 85%+ positive for competitive positioning |
A few notes on these benchmarks. The industry average first-time fix rate sits around 74%, while world-class operations reach 85–90%. Every repeat visit costs you roughly 1.5x a normal job. You pay full drive time and labor, but earn no additional revenue. On utilization, a tech at 55% utilization who moves to 70% adds roughly 1–1.5 billable hours per day without hiring anyone new.
How to Choose the Right KPIs for Your Business
The most common dashboard mistake is tracking everything. Adding more metrics only adds noise, not clarity. Start with the decision you need to make, then pick the metric that informs that decision.
Here is how that looks in practice:
- Struggling with cash flow? Focus on time-to-invoice and days sales outstanding. Under 15 days DSO is the benchmark for businesses with in-field payment collection; under 30 days for invoice-based businesses.
- Missing appointments? Track on-time arrival rate and schedule adherence. Late arrivals are the top driver of negative customer reviews in field service.
- Adding techs and worried about quality? Watch first-time fix rate and technician utilization together. A rising utilization rate paired with a falling fix rate means your team is overloaded.
- Unsure which jobs make money? Track job profitability by type. You may find that certain service categories consistently underperform, which points to a pricing or scoping problem you can fix.
Watch out for vanity metrics, which are numbers that look good but do not lead to action. “Total jobs completed this month” is one example. It does not tell you whether those jobs were profitable, whether customers were satisfied, or whether your techs were stretched too thin. In short, if a metric goes red and you do not know what to do about it, it is noise, not insight.
FieldPulse’s reporting and dashboards let you track these KPIs automatically from your job data, and the framework works regardless of which tool you use.
Role-Based Dashboard Views: What Each Person Needs to See
Each role in your business needs a different view of the numbers. A single dashboard for everyone usually fails everyone.
Your owner does not need to see every job status. Your dispatcher does not need to see profit margin details. Your techs need to know what is next on their schedule, not what the business earned last quarter.
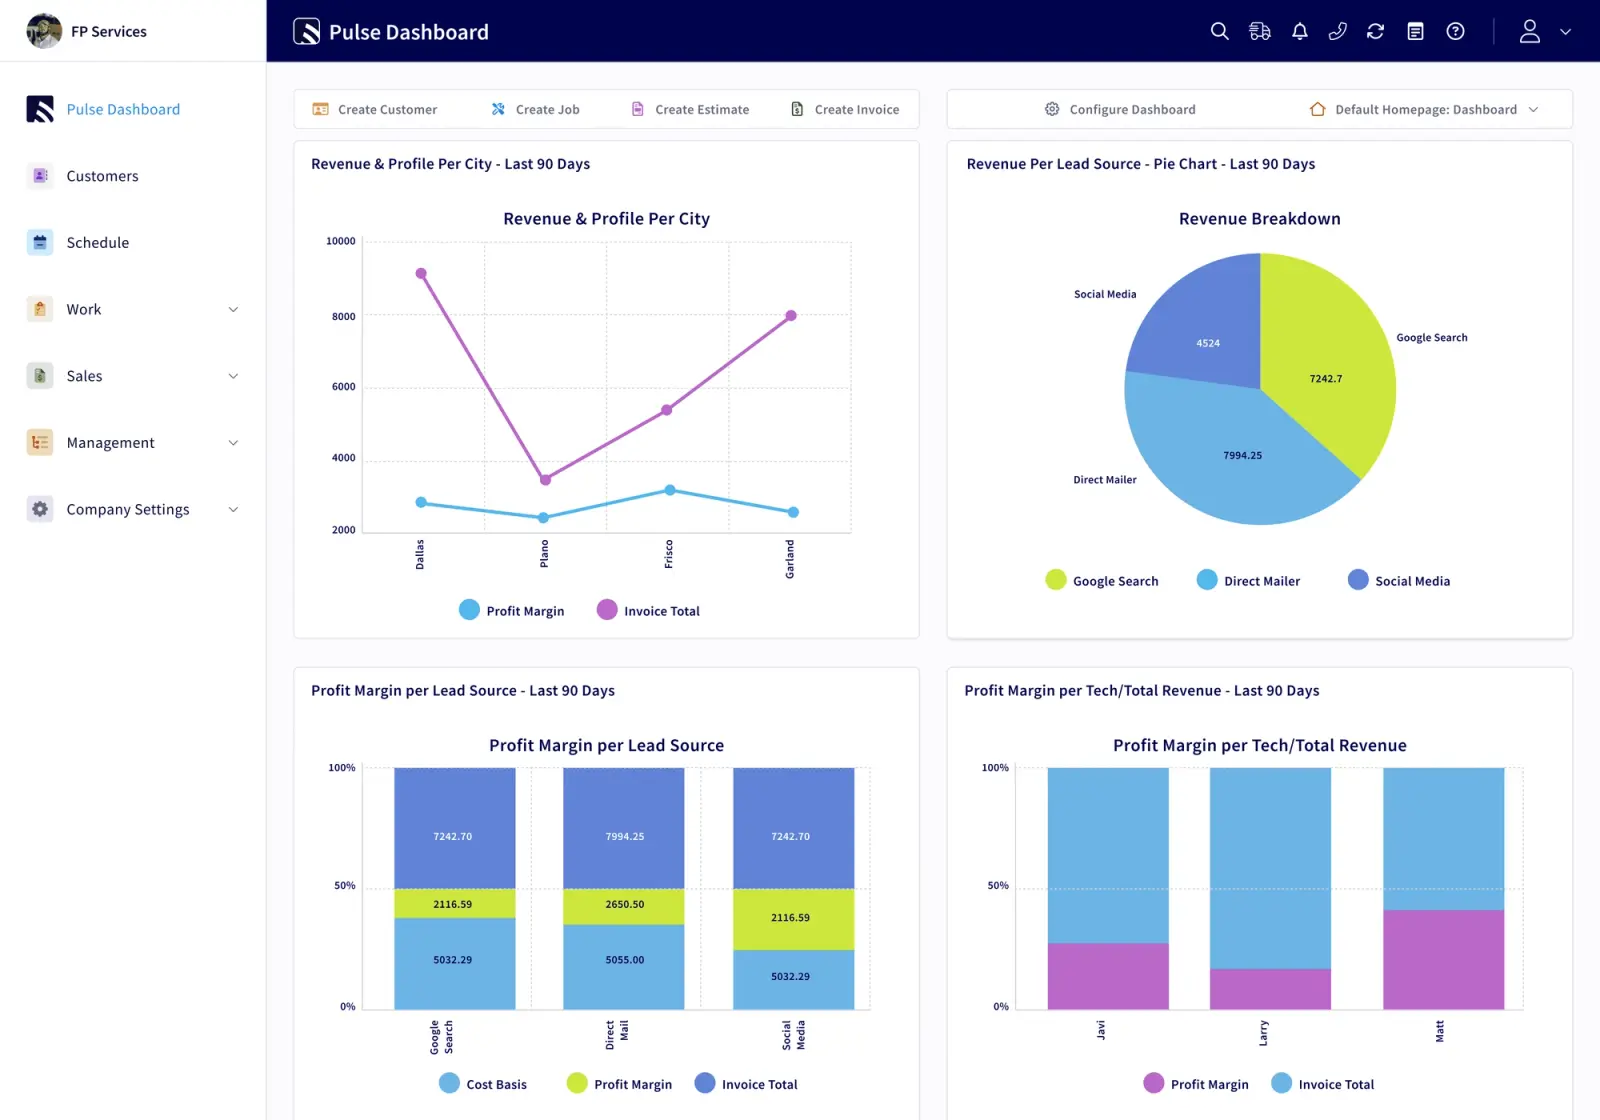
Owner or operations lead: This view should answer three questions: Are we growing? Are we profitable? Where are the exceptions? To answer them, the owner needs high-level financial and growth metrics such as revenue by job type, outstanding invoices, job profitability by service category, and capacity trends. The goal is to spot patterns and outliers and stay out of daily details.
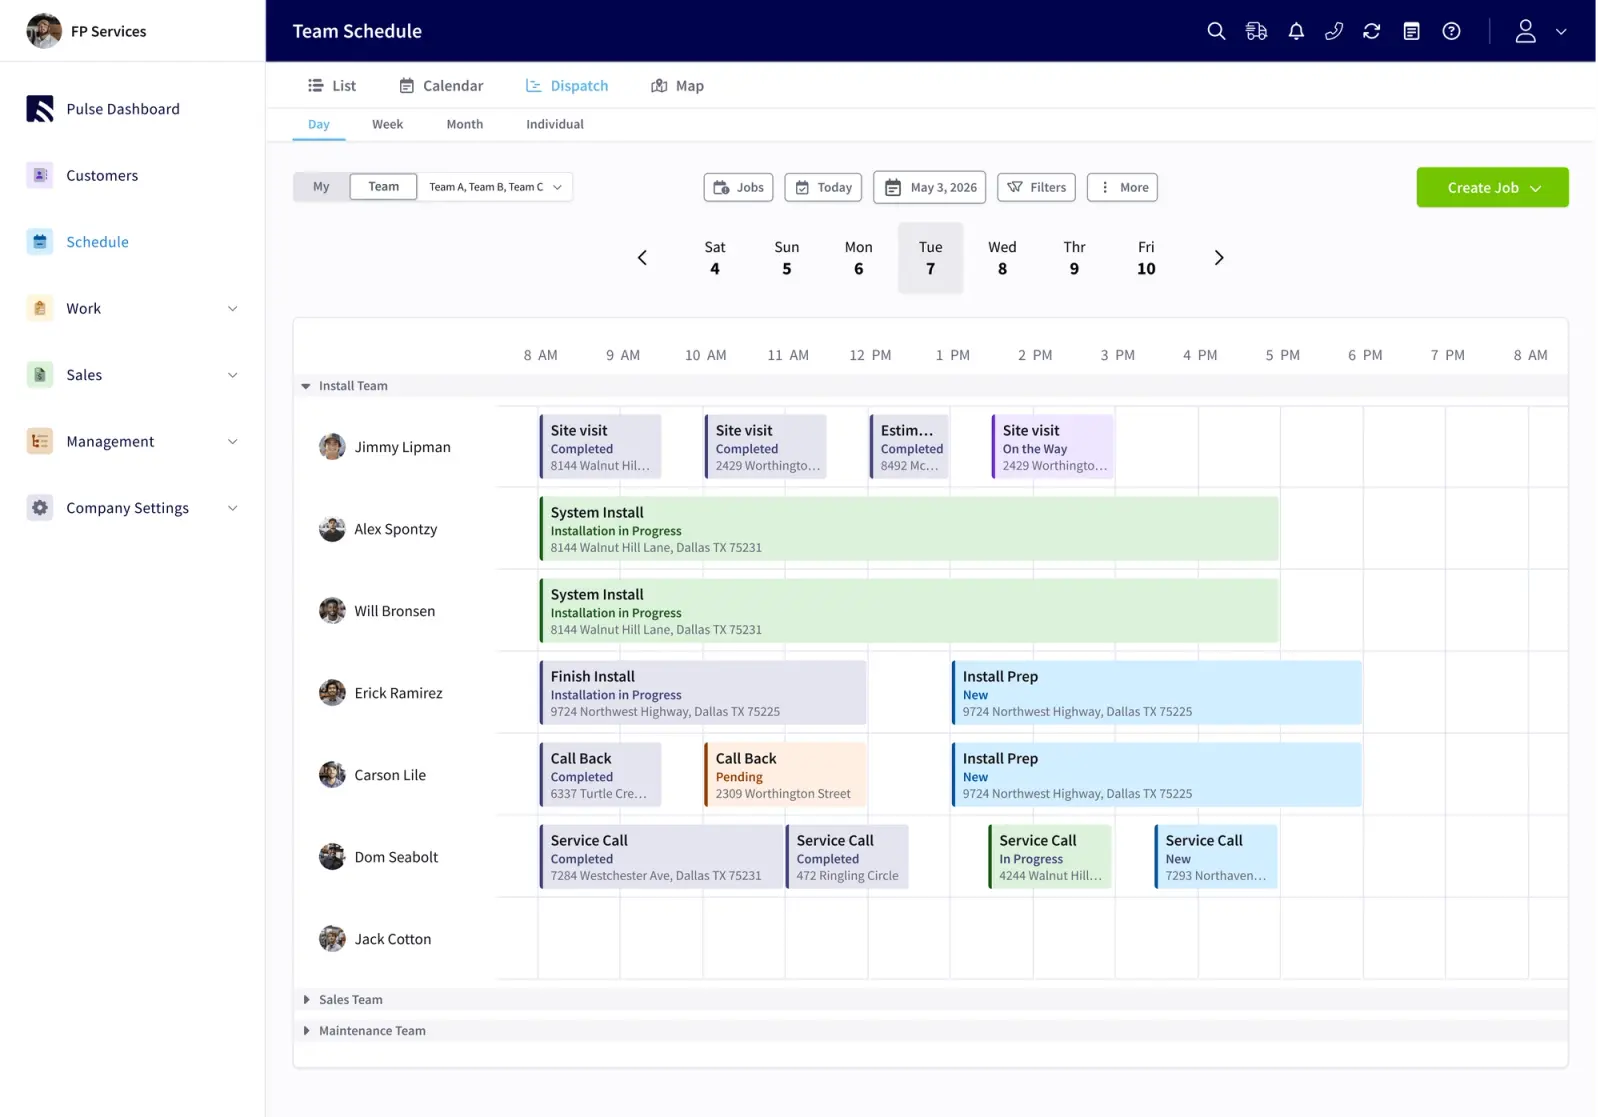
Dispatcher or office manager: This view focuses on real-time operational metrics. It should answer what is happening right now and what is about to go wrong. Key tiles include today’s schedule, job statuses, technician locations, missed or delayed appointments, and average response time. A dashboard that only updates overnight cannot help you respond to problems during the working day.
Technician: This view shows their schedule, job details, and personal performance. Keep it simple. Techs need to know where to go, what the job requires, and what is expected at each stage. They do not manage the business, so financial data they cannot act on only creates confusion.
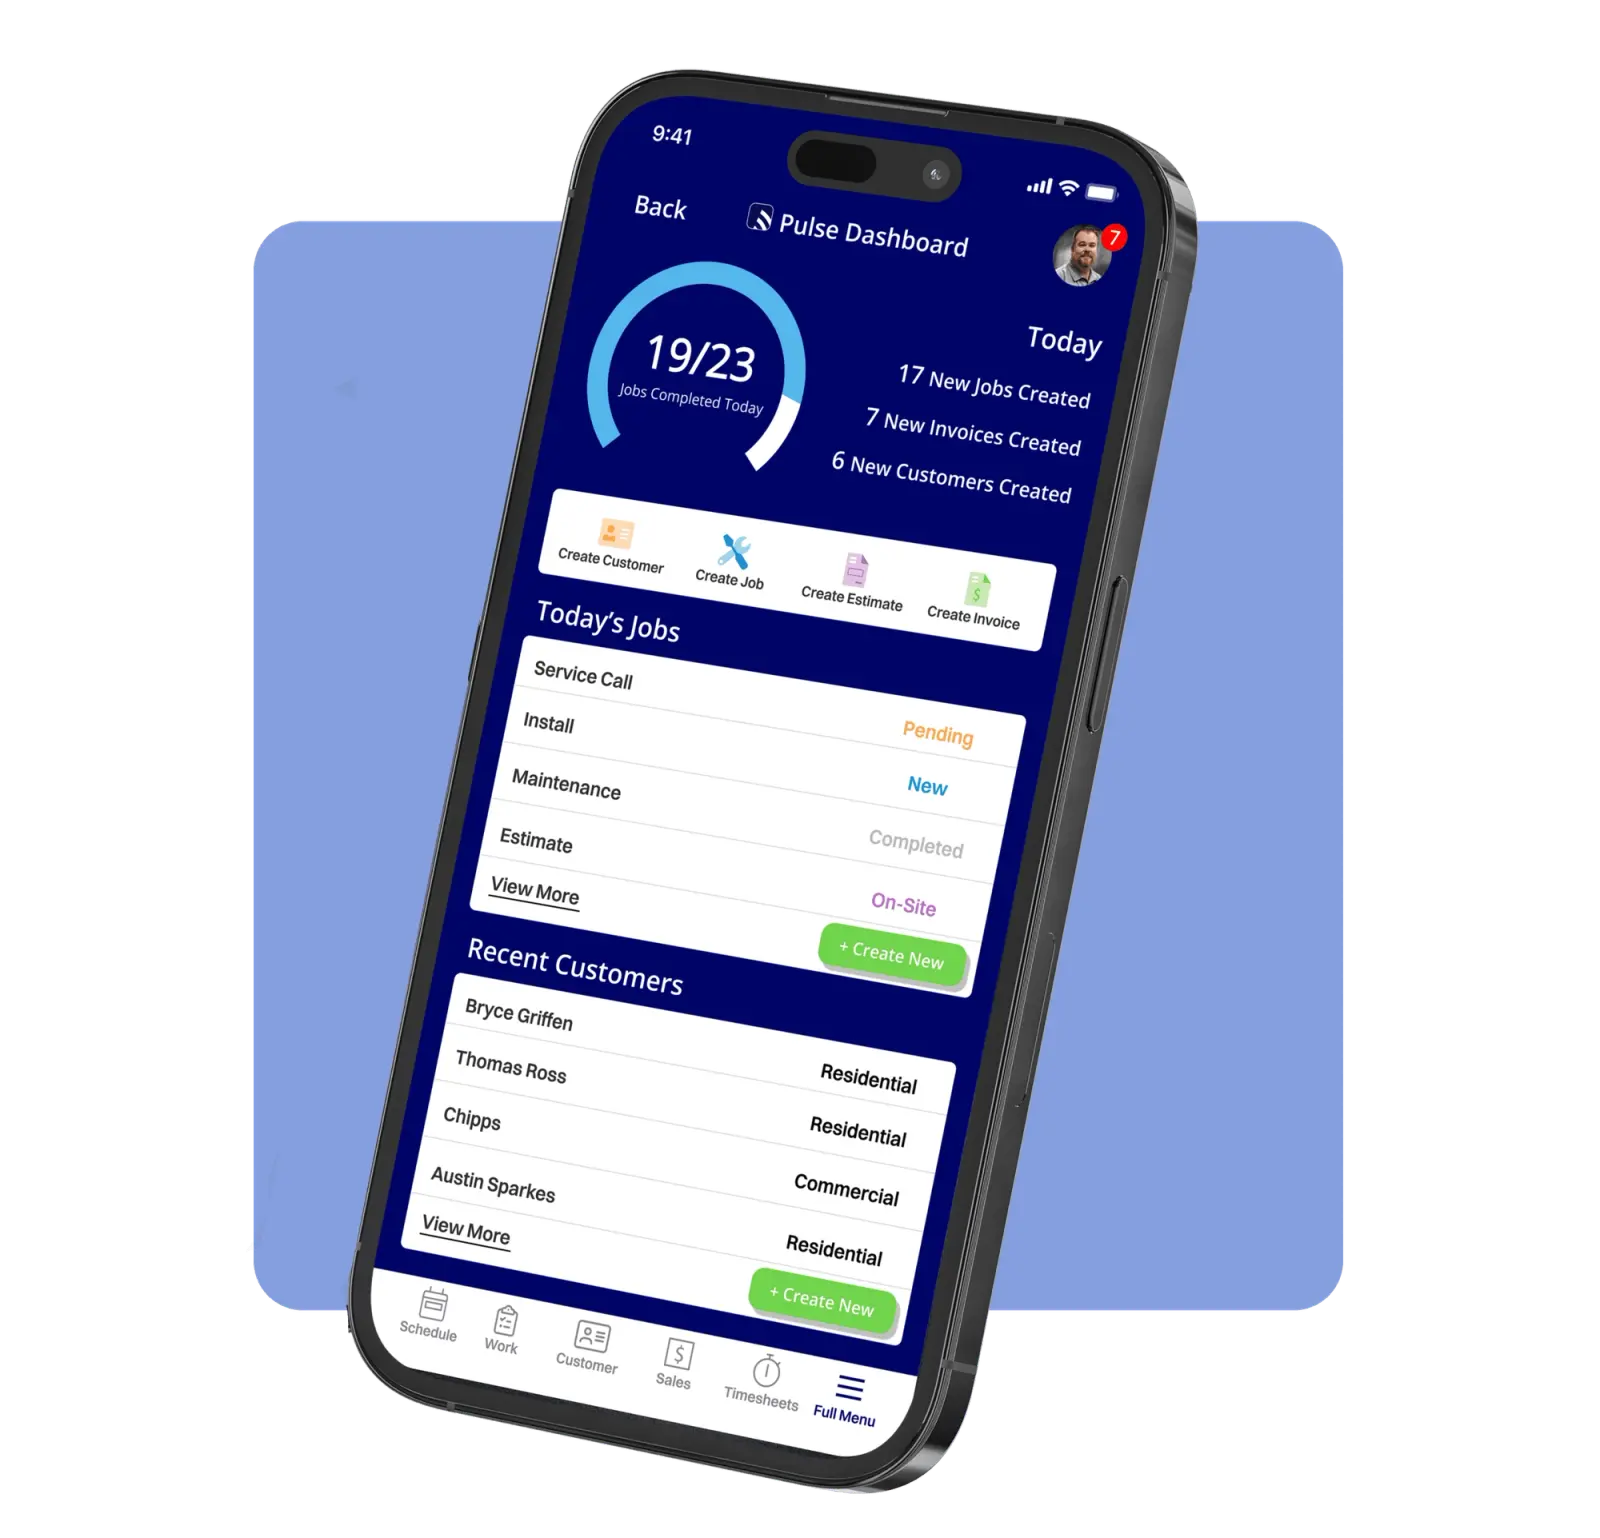
FieldPulse lets you build custom dashboards for each role, all pulling from the same job data. Everyone works from one source of truth, so your dispatcher and your owner see the same numbers and avoid arguments about which data is correct.
See what role-based dashboards look like in practice. Schedule a walkthrough.
Dashboard Design Best Practices
Good dashboard design makes the right information visible at a glance. These principles help your team read and use the dashboard quickly.
- Limit to 5–7 KPIs per view. The optimal KPI count for managers is 5–7; more than that creates analysis paralysis. If you need more data, use drill-downs rather than adding more tiles to the main view.
- Use visuals that match the data. Trend data works best as line charts. Comparisons work best as bar charts. Single important metrics belong in KPI cards. Start with the business question, then choose the chart type that answers it clearly.
- Put the most important metrics top-left. Eye-tracking research shows users spend most of their first seconds on the largest, top-left tile. Place your headline KPI there.
- Enable drill-down. Users should be able to click a metric to see the underlying data. A dispatcher who sees response time trending up needs to know which jobs or techs are driving it.
- Automate data feeds. Manual updates kill adoption. If someone has to remember to update the dashboard, it will be stale within a week. FieldPulse updates dashboards in real time from job data, so you avoid spreadsheet chasing.
- Review regularly. A dashboard works best as a living tool. Schedule a weekly or monthly review to discuss what the numbers show and decide what to do about it. Track operational KPIs weekly and financial KPIs monthly. Daily variation is usually too noisy to act on.
Common Dashboard Mistakes to Avoid
Most dashboard problems come from structure, not technology. These are the issues that show up most often in field service businesses.
- Tracking too many metrics. The most common mistake is trying to measure everything at once, which leaves you drowning in metrics and unable to see what matters. Start with 3–5 KPIs tied to your current biggest pain points.
- Using only lagging indicators. Revenue at month-end tells you what happened. Schedule adherence and response time tell you what is happening now. Each outcome metric should have at least one leading indicator paired with it.
- Ignoring data quality. If your techs are not clocking in and out accurately, your utilization numbers are meaningless. FieldPulse’s mobile app makes time tracking straightforward and ties hours directly to jobs, so the data feeding your dashboard stays reliable.
- Skipping role-based views. Dispatchers should focus on operational metrics, while owners should focus on financial and growth metrics. One-size-fits-all dashboards usually get ignored.
- Building a dashboard and never acting on it. A dashboard without a decision culture is decoration. For each metric, define what you will do when it moves in the wrong direction. If you cannot answer that, the metric probably does not belong on your dashboard.
How to Implement a Field Service KPI Dashboard
A useful dashboard needs more than a list of metrics and a software tool. Follow this sequence to roll one out that your team actually uses.
- Define your goals. Decide which decisions you need to make. Start there. The dashboard should support those decisions.
- Identify your data sources. Map where the data lives today. That might include job management software, QuickBooks, spreadsheets, or access files. You need a clear picture before you can automate anything.
- Choose your tool. Excel can work, but it requires manual data entry and goes stale fast. FieldPulse automatically captures job data such as timesheets, invoices, and job statuses and offers 60+ prebuilt reports plus custom dashboards. Your KPIs stay current without someone updating a spreadsheet every morning.
- Set up role-based views. Build separate views for your owner, your dispatcher, and your techs, as described above. Each person should open their dashboard and immediately see what they need to act on.
- Train your team. Explain to your techs why accurate data entry matters. If they do not clock in against the right job, your utilization numbers are wrong. If they do not update job statuses, your dispatcher works in the dark.
- Review and refine. Meet monthly to discuss what the dashboard shows and adjust. Drop metrics that are not driving decisions and add ones that are.
FAQ
What are the 5 main KPIs for field service?
The five core KPIs most field service businesses should track are first-time fix rate, technician utilization, average response time, revenue per job (or job profitability), and customer satisfaction (CSAT). These five connect directly to the decisions owners and dispatchers make every day, such as whether to coach a tech, adjust scheduling, change pricing, or follow up with a customer. Start with these before adding anything else.
How many KPIs should be on a field service dashboard?
Limit each dashboard view to 5–7 KPIs. More than that creates cognitive overload and makes it harder to spot what actually needs attention. If you need additional detail, use drill-downs rather than adding more tiles to the main view. Different roles should have different views, so your owner’s dashboard and your dispatcher’s dashboard will look different.
What is a good first-time fix rate for a field service business?
For most residential field service businesses such as HVAC, plumbing, and garage door, a first-time fix rate of 75–85% is a solid target, with 90% or above considered excellent. If your rate is consistently below 70%, it usually points to one of a few root causes: techs arriving without the right parts, sending the wrong tech for the job type, or incomplete job information at the time of dispatch. Each repeat visit costs you roughly 1.5x a normal job in labor and travel with no additional revenue, so improving this number has a direct impact on your profit margin.
How do I track technician utilization accurately?
Technician utilization requires two data points: billable hours and available hours. The formula is (billable hours ÷ available hours) × 100. The challenge is getting accurate billable hours, which means your techs need to clock in and out against specific jobs, not just against a shift. When time is tied to jobs rather than to a weekly total, you can see utilization by tech, by job type, and by day. Field service software like FieldPulse captures this automatically through mobile timesheets, so you are not reconstructing hours from memory at the end of the week.
Can I build a field service KPI dashboard in Excel?
You can build a basic dashboard in Excel, but it comes with real limitations. Excel requires manual data entry, which means your dashboard is only as current as the last time someone updated it. In a busy operation, that is often not current enough to act on. It also does not scale well as your team grows. Field service software automates data collection from job records, timesheets, and invoices, so your dashboard reflects what is actually happening right now. If you are starting out and Excel is what you have, use it, and plan to move to a purpose-built tool as your team grows past a handful of techs.
How does FieldPulse help with KPI dashboards?
FieldPulse automatically captures the data that feeds your KPIs, including job statuses, technician timesheets, invoices, and job costs, as work happens in the field. That data flows into 60+ prebuilt reports and custom dashboards, so you are not manually compiling numbers from multiple sources. You can build role-based views so your owner sees financial and growth metrics, your dispatcher sees real-time operational status, and your techs see their schedule and job details. Because FieldPulse also includes a two-way QuickBooks Online sync, your financial data stays consistent between your field software and your books, which keeps your job profitability numbers reliable.
Turn Your KPI Dashboard into Daily Decisions
A KPI dashboard earns its place when it changes what you do next. Start with the decisions you face, pick the few metrics that inform them, and build views that put those numbers in front of the right person at the right time. When your team trusts the data and knows how to act on it, your dashboard becomes a daily tool for running a more profitable, more predictable business.